Phase 1:
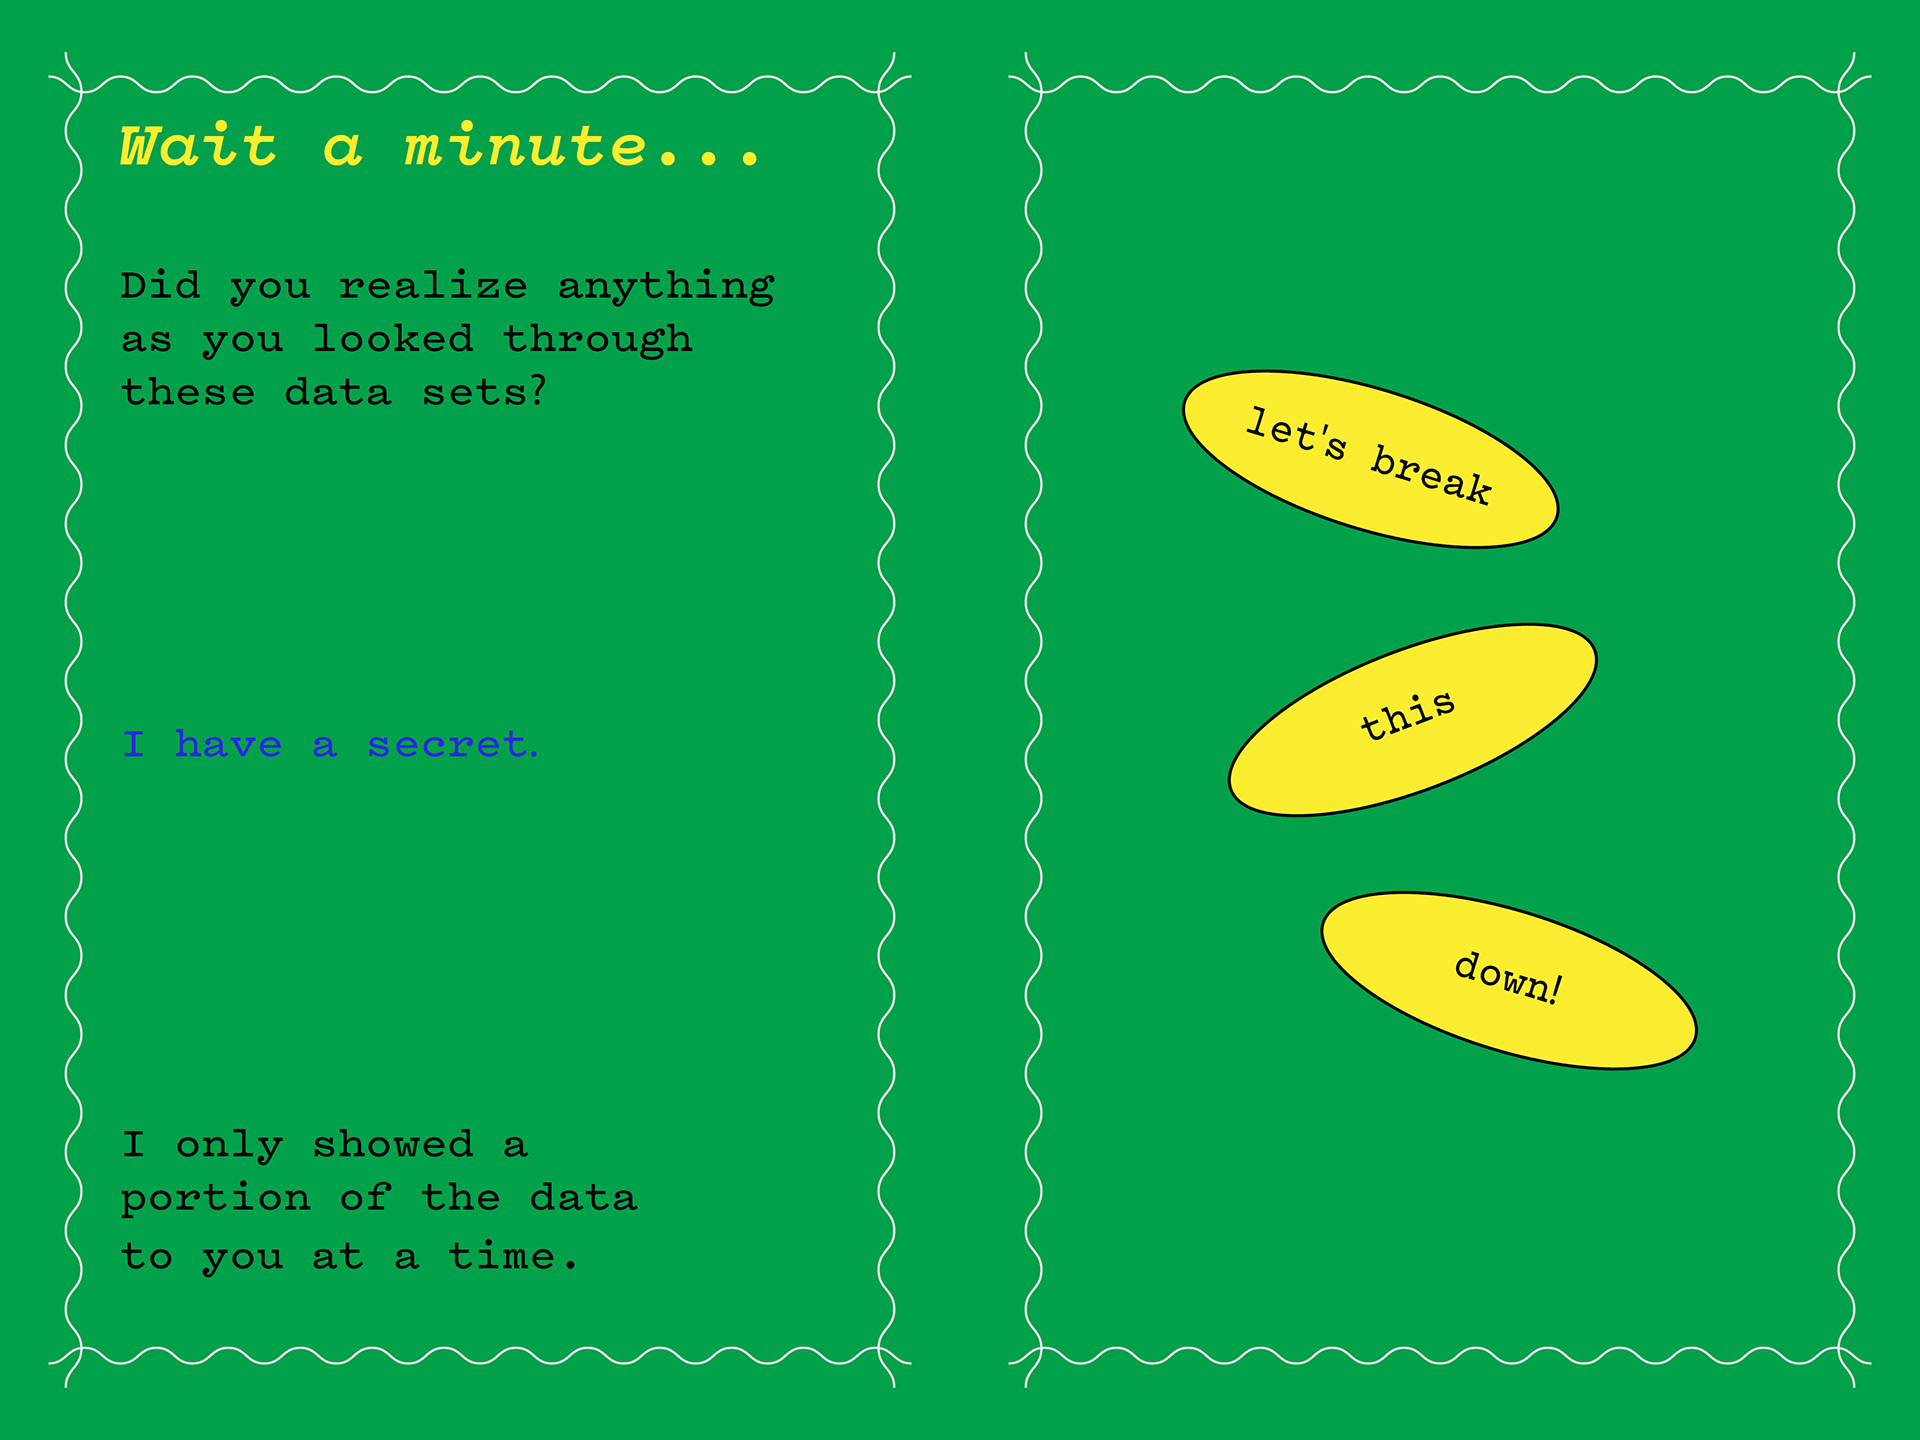
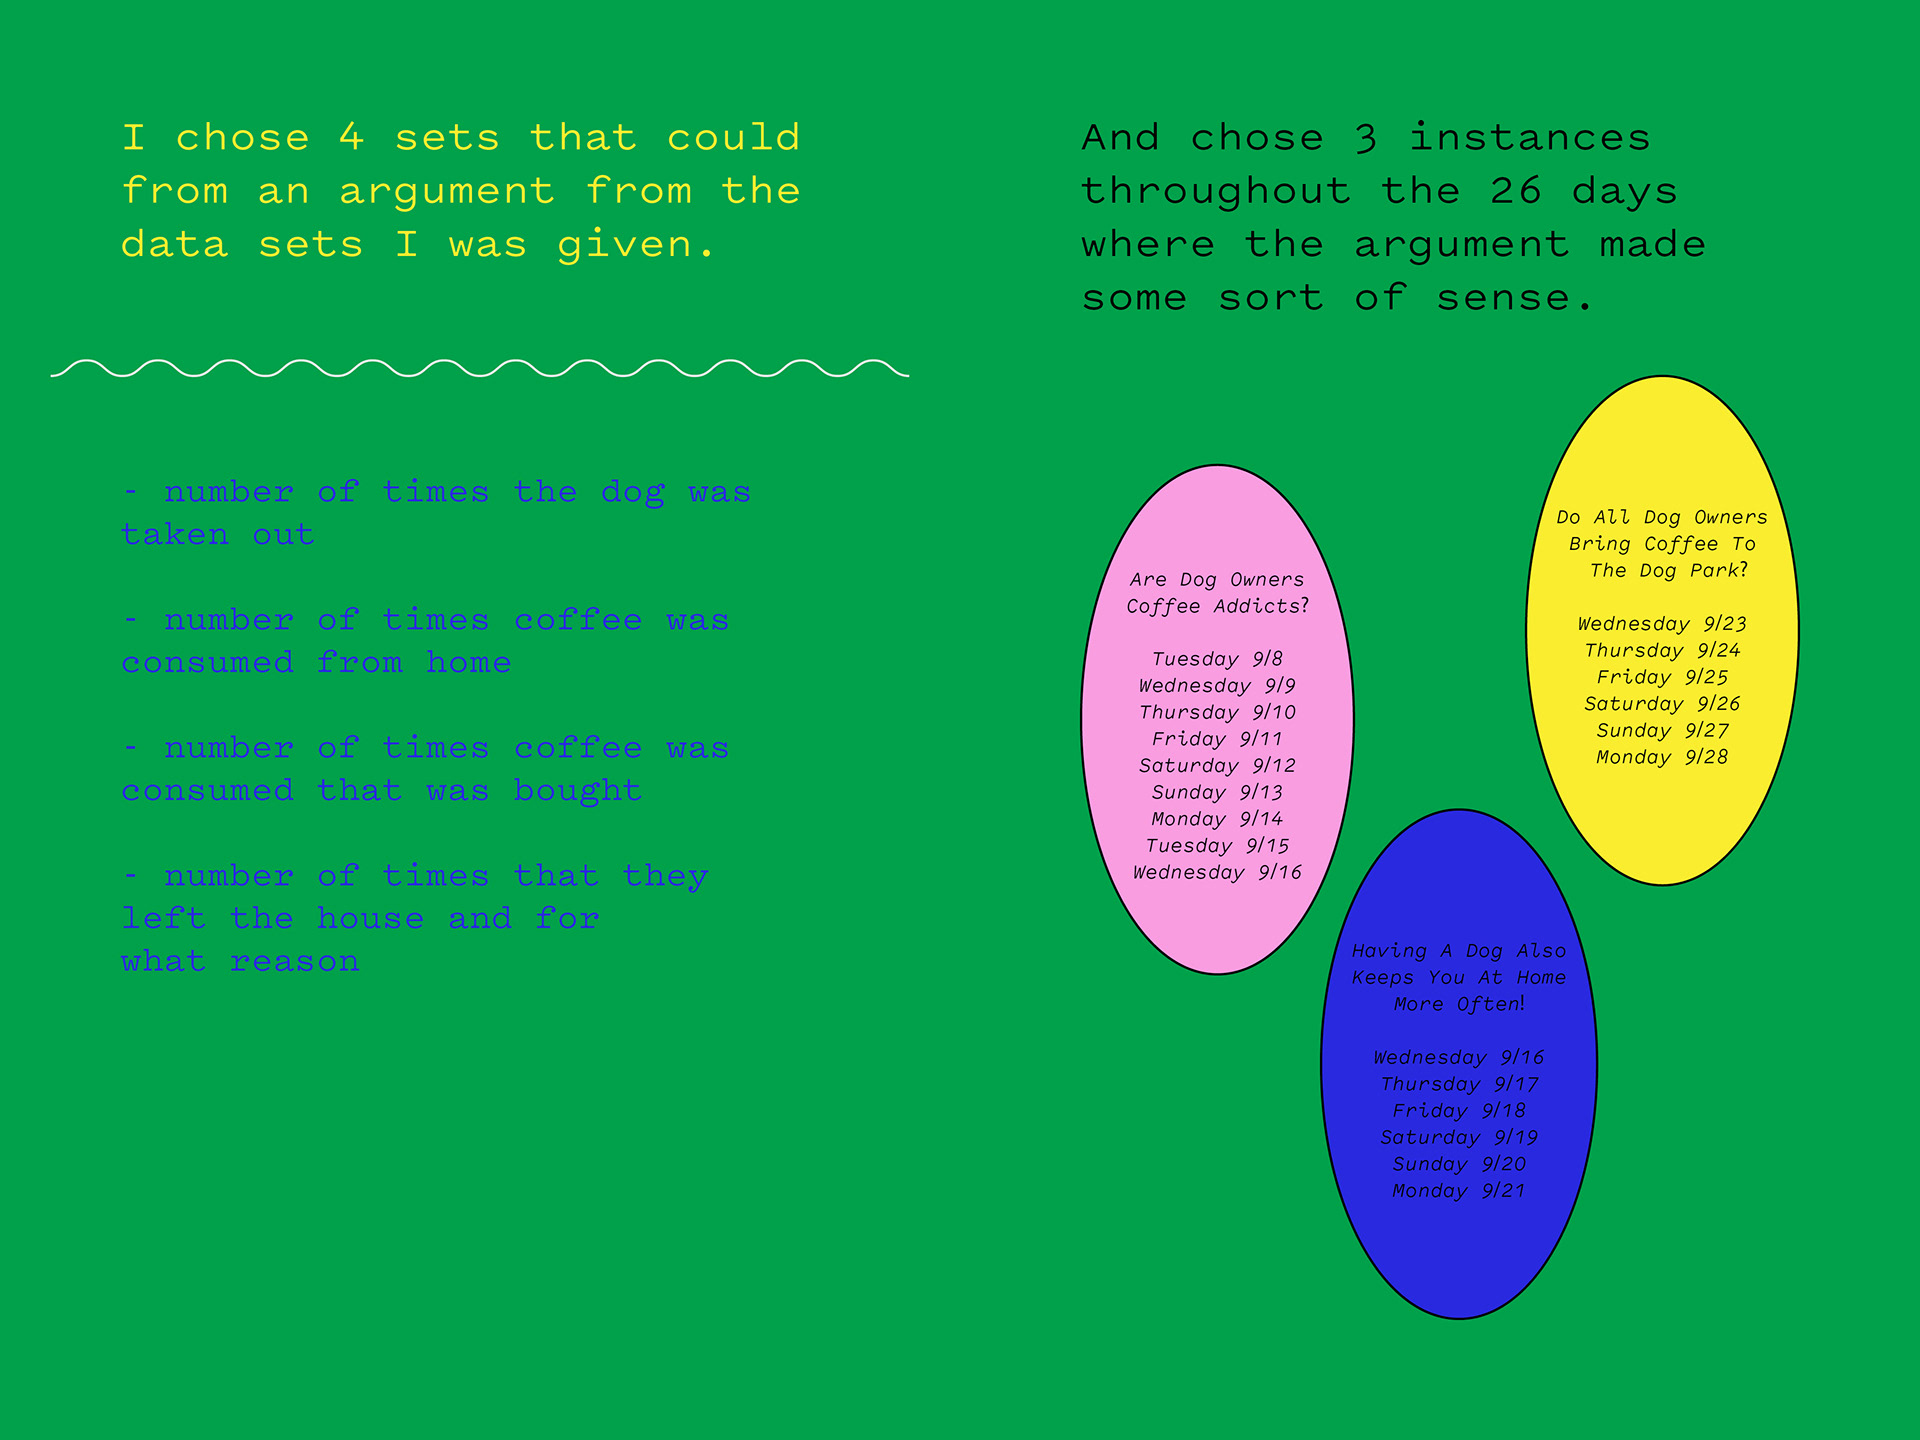
After I removed parts of the data that I was given by my anonymous classmate I created these visualizations. Then they were put onto instagram slides to convey my information in a quick and consumable way.

Phase 2:
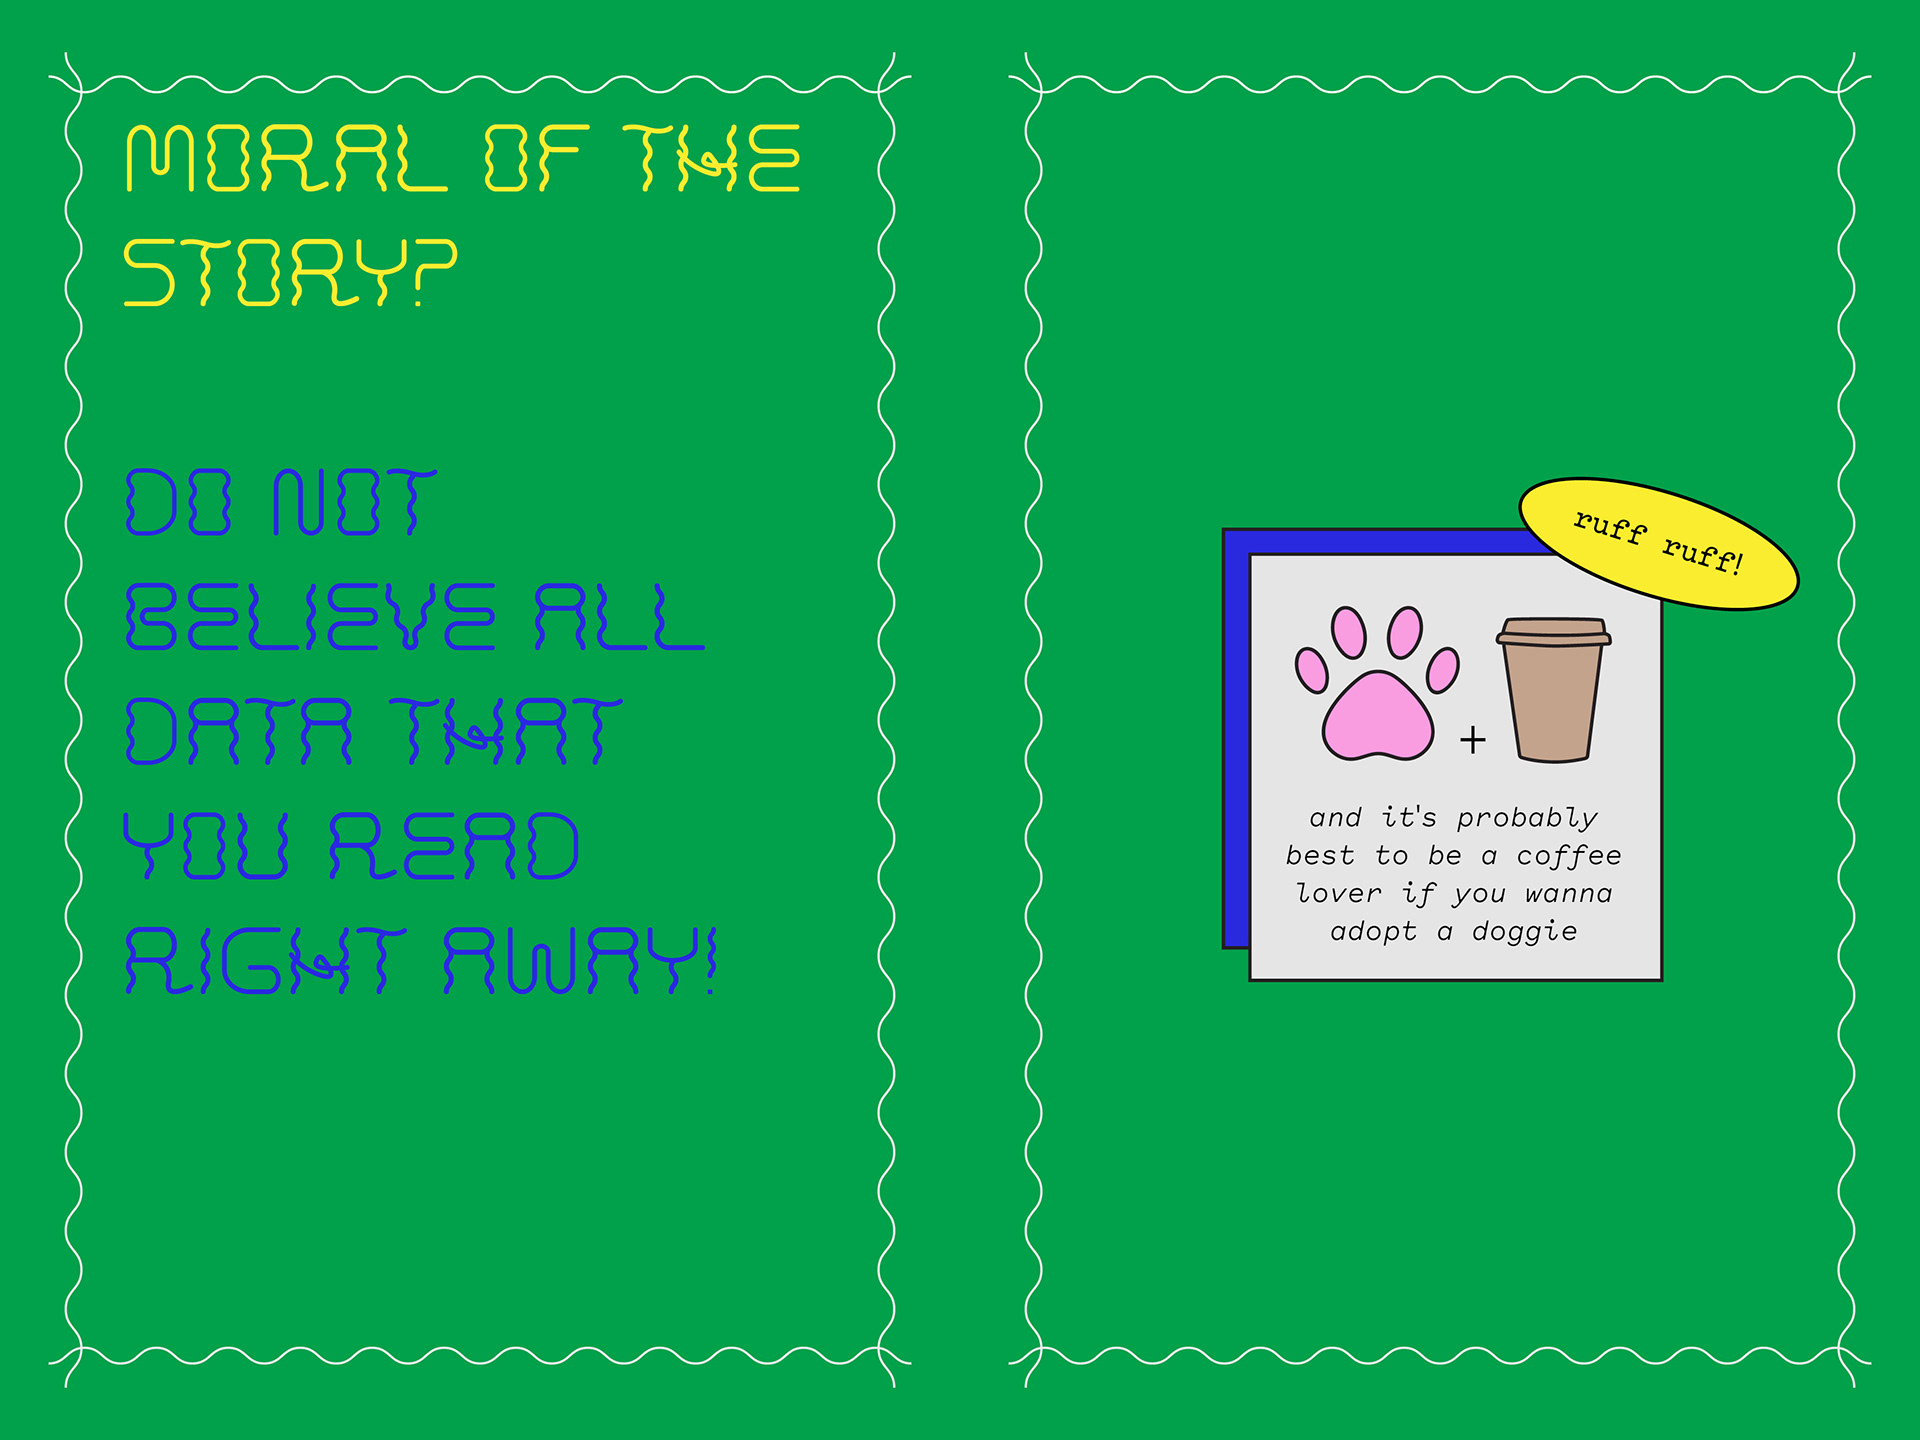
Next, I created a zine that further revealed the entire story! I showed viewers the eoriginal data set, what I chose to reveal to tell a story, and concluded that all data is biased.